The Prospective Threat of Long COVID: Understanding Future Risks
Written on

Minor update — I was informed that the maximum occurrence of seasonal non-COVID coronaviruses is likely higher, prompting an update to this text.
As the COVID-19 pandemic has unfolded, one clear trend has emerged: the individual risk associated with the virus is diminishing. Back in 2020, my analysis of death rates, based on extensive research, indicated alarmingly high mortality per infection. By 2023, estimates suggest that the danger from an acute COVID-19 infection has decreased by at least a factor of ten, bringing its lethality in line with that of influenza and other seasonal illnesses.
This is quite remarkable.
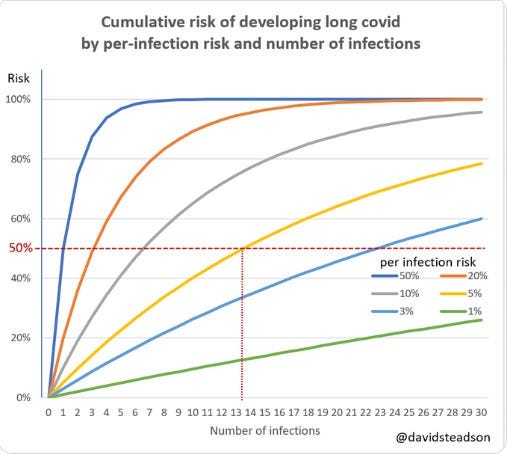
However, COVID-19 isn't solely responsible for immediate health outcomes; concerns remain regarding long-term effects, commonly referred to as Long COVID. Many people are anxious that even with the significant decline in COVID-19 severity, the risk of Long COVID will persist substantially into the future. This anxiety is vividly illustrated by a graph circulating online that depicts the cumulative risk of developing Long COVID.

This graph encapsulates widespread fears—that despite decreased COVID-19 fatality, many individuals will inevitably suffer serious health consequences. I intend to clarify why this graph may be misleading and explain why, despite COVID-19 and Long COVID remaining ongoing issues, the likelihood of experiencing long-term symptoms in the future is probably quite low.
This assertion doesn't imply that Long COVID is no longer a concern; many individuals continue to experience severe symptoms years after their initial infection. Nevertheless, it suggests a much brighter outlook at the population level than what the aforementioned graph might imply.
Future Predictions
I've previously discussed the current risk of Long COVID. Various data sources reveal similar trends: the risk was approximately 10% per infection in 2020, decreasing to around 3% by late 2021, and further dropping to about 1-2% by 2023.
But what does the future hold? The aforementioned graph suggests a consistently rising risk of Long COVID per infection, with varying rates of increase. This indicates that each infection is assumed to carry the same risk of developing long-term symptoms, leading to the impression that most individuals will experience multiple COVID-19 infections over time. This perspective is misleading for two primary reasons:
- The risk of infection is declining over time. This is a well-established fact. According to the Office for National Statistics in the UK, their COVID-19 infection survey showed that the proportion of the population infected peaked during the Omicron wave in 2022 and has since decreased. Although data collection for this survey ceased in March 2023, figures up to that point indicated an average of slightly over one infection per person in 2022, which has significantly declined by early 2023. The ONS has since initiated a new dataset with the UKHSA, known as the Winter Coronavirus Infection Survey. This survey uses lateral flow tests instead of PCR testing, which typically yields slightly lower results. Initial findings suggest that roughly 1% of people in the UK had COVID-19 in late November 2023, compared to about double that figure a year prior.
- The risk of developing Long COVID per infection is significantly decreasing. The ONS estimated that the incidence of Long COVID dropped by approximately 30% after a second infection compared to the first. A recent study from Sweden indicated that the risk of Long COVID following a wild-type COVID-19 infection was nearly ten times greater than that for Omicron. Another study using the robust REACT dataset in England found a similarly substantial decline in Long COVID risk between 2020 and 2022. Current evidence suggests that vaccination may reduce the risk of Long COVID by up to 73%. While precisely quantifying the reduction in risk per additional infection is complex, we can confidently state that the incidence of Long COVID has decreased by at least half each year since 2020.
When we combine these two well-supported facts, we find ourselves in a situation where individuals are not only less likely to contract the virus each year, but also where each infection is less likely to result in Long COVID.
Considering the data thus far, in 2022, which was the peak year for COVID-19 infections, there were approximately 1.3 infections per person in the UK according to ONS data. Although precise figures for 2023 remain uncertain, UK statistics on hospitalizations and deaths suggest that the number of infections has decreased by at least half. As previously mentioned, ONS data indicates a similar reduction in infection rates. While still relatively high, the rates of infections should eventually align more closely with the patterns of endemic seasonal coronaviruses, which historically infected 1-15% of the population annually prior to COVID-19.
In this context, the original graph becomes even more problematic. If we assume that individuals will continually contract COVID-19 at a high frequency—for instance, once every two years—it would take 60 years to accumulate 30 infections. If infection rates decline to levels more characteristic of endemic, seasonal coronaviruses, then most individuals would likely never contract the virus more than three or four times.
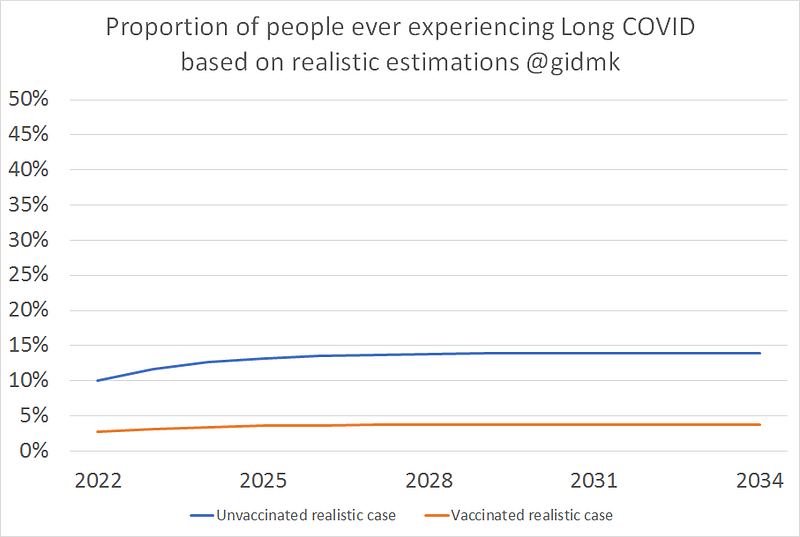
If we were to construct a realistic estimate starting in 2022, assuming 100% infection in the first year and a declining proportion thereafter, and considering that 10% of infected individuals experience Long COVID, while that percentage also decreases over time, the graph would resemble the following:

While many assumptions underpin this projection, they are not far-fetched. The graph levels off around 15% or 5% based on whether individuals were vaccinated in 2022. Interestingly, this prediction aligns with the CDC's Household Pulse survey, which estimates that roughly 15% of U.S. adults report having experienced long-term symptoms related to COVID-19, a figure that has remained stable in 2023.
Models and Predictions
An old adage in statistics is worth remembering: all models are wrong; some models are useful. Both my graph and the original one are unlikely to accurately depict reality.

Nevertheless, we can speculate on how risk may evolve over time, and current evidence suggests a plateau rather than a relentless rise. For example, there was a notable surge in sickness-related absences around the time of the major Omicron waves in 2022, but those numbers have since dropped significantly to more typical levels. While the incidence of individuals out of work in the UK has been on the rise since 2019, with reported disabilities increasing since 2011, applications for disability services in some countries have either plateaued or declined since the pandemic began. Estimates attempting to assess the causal impact of Long COVID on increased disability indicate that only a small fraction of those reporting work absences attribute it to Long COVID. We are not witnessing a substantial increase in disability since the onset of the pandemic, which would be expected if a significant portion of the population were experiencing severe Long COVID.
All available evidence indicates that the risk of Long COVID was highest during the early days of the pandemic and has since decreased significantly. The data suggests that the peak of Long COVID has likely passed, and the risk is expected to continue declining over time. While this presents a more complex picture when considering entire lifetimes—such as a 40-year-old today facing increased Long COVID risk as they age, particularly by the time they reach 85—over the next decade or two, we have a clearer understanding of potential outcomes.
This does not imply that Long COVID is no longer a concern. Numerous individuals who fell ill in 2020 continue to suffer immensely years later. Even if the incidence of Long COVID is currently low and decreasing, the sheer volume of infections means that the number of new Long COVID cases will likely remain in the hundreds of thousands in the U.S. for years to come. However, it is reassuring to note that the most severe consequences of the pandemic, including Long COVID, are almost certainly behind us as we move into 2023.