Unpopular Candidates: The Surprising Math Behind Elections
Written on
Understanding Unpopular Candidates in Elections
If you've been observing the political landscape for some time, you might have noticed that candidates who lack popularity sometimes manage to secure wins. Surprisingly, mathematics offers a clear explanation for this occurrence.
The phenomenon at play is referred to as the Asymmetric Dominance Effect. For those interested in a more accessible introduction to this concept, I have previously written a non-technical essay that serves as a precursor to this discussion.
In this piece, I will delve into the mathematical principles behind the asymmetric dominance effect using a straightforward, yet realistic example. Following this exploration, I will also present a mathematical method that could mitigate the asymmetric dominance effect. Let's dive in.
The Dynamics of Unpopular Candidates
Imagine a fictional election scenario in the town of Mathville featuring two candidates, A and B. Here, 48% of the residents prefer candidate A, while 49% favor candidate B.
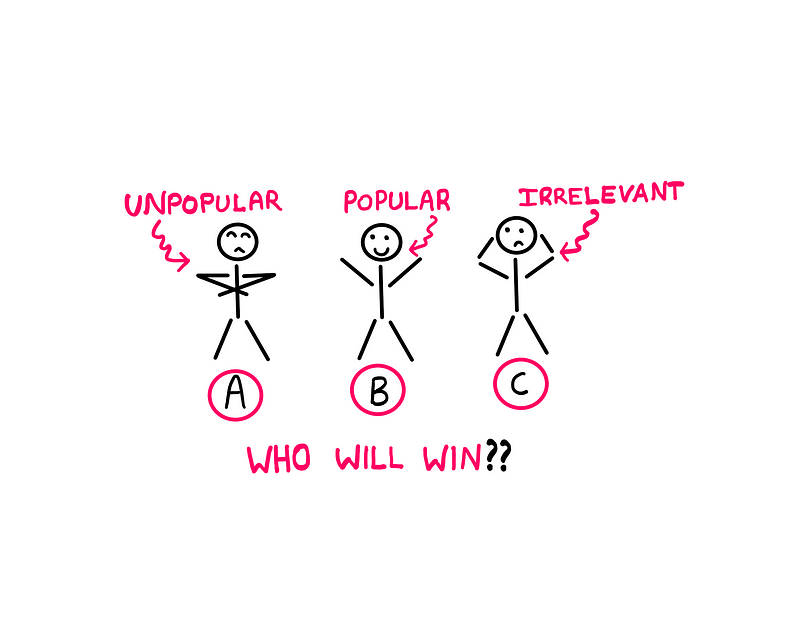
In a direct contest between A and B, you would expect candidate B to emerge victorious. However, akin to real-world situations where minor parties exist, there is also a seemingly inconsequential candidate C in Mathville, who has garnered 3% of the votes.
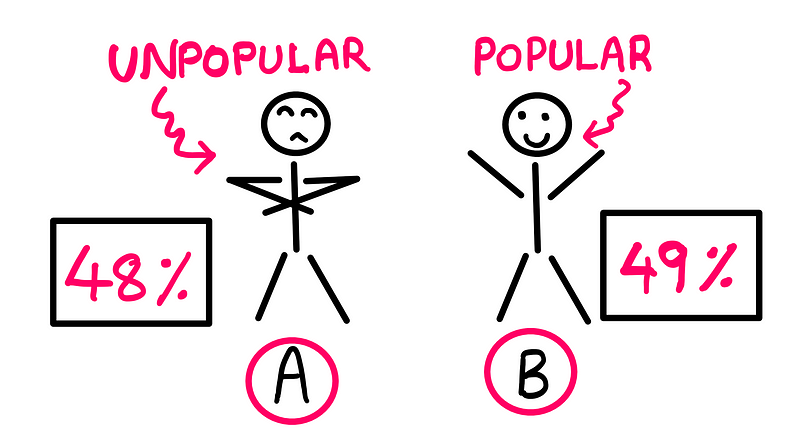
When these three candidates compete, it would initially appear that candidate B would still win by a narrow margin, with candidate C receiving only a minimal share of the vote. However, in an actual election held in Mathville, candidate A surprisingly received 49% of the votes, while candidate B obtained 48%, and candidate C captured 3%.
Thus, the unpopular candidate secured victory simply by introducing what seemed to be a trivial competitor into the race. Fascinating, isn't it? Let’s explore the mechanics behind this unusual occurrence.
The Mechanism of Asymmetric Dominance
Before delving into a detailed analysis, it's essential to clarify one fact: candidate C was never a contender for winning the election. This is a well-known fact among the residents of Mathville.
Why is this significant? When voters in Mathville cast their ballots, they were essentially deciding:
"Should candidate A win, or should candidate B win?"
rather than
"Should candidate A, B, or C win?"
The presence of the irrelevant candidate C inadvertently tilted the results in favor of candidate A, despite the fact that the majority preferred candidate B. This illustrates the asymmetric dominance effect at work.
You will soon see—through mathematical analysis—how elections involving multiple candidates can lead to paradoxical outcomes. The irrelevant alternative plays a crucial role, revealing that the majority does not always prevail. This ambiguity arises from the nature of the question being asked.
The Mathematical Underpinnings of Asymmetric Dominance
The question posed is fundamentally binary: yes or no; either/or. If a candidate preferred by most voters ends up losing, we must examine our voting system. A critical observation about our current voting structure is that it fails to account for the preferences of those who backed candidate C, preventing them from expressing a preference for candidate B over A, or vice versa.
To illustrate this more clearly, let’s consider a different voting framework in which individuals rank their preferences for available candidates:
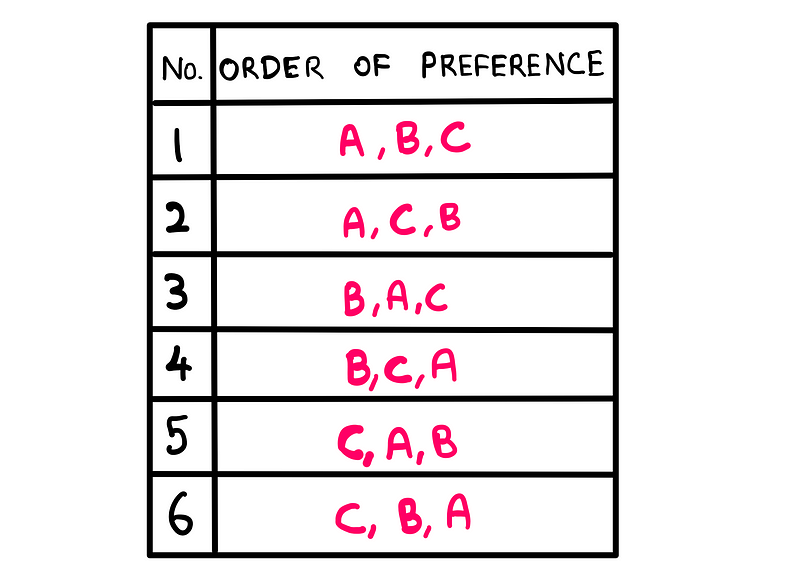
If we were to conduct the election using this revised system in Mathville, we would achieve a distribution resembling the following:
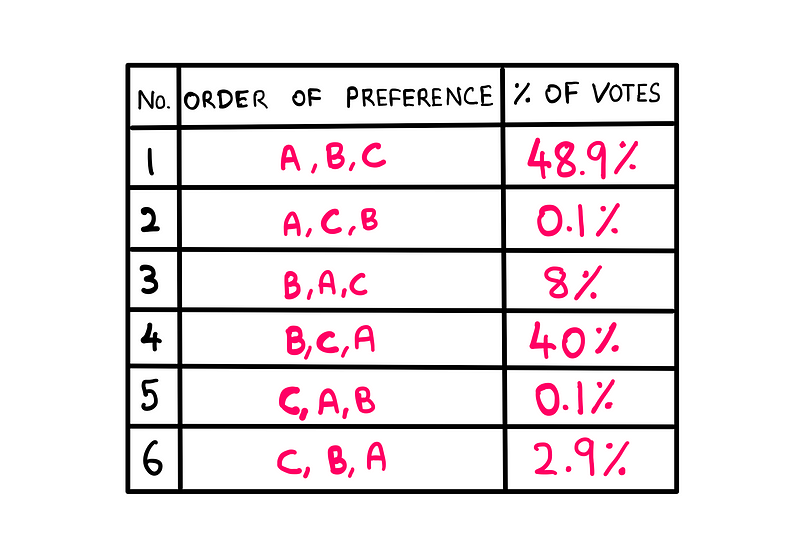
The previous voting system only accounted for first-choice preferences. If we tally the percentages based solely on first-ranked candidates, the outcome remains unchanged. However, with this new system, we gain more insight.
By examining all ranking combinations where candidate B ranks higher than candidate A (specifically combinations 3, 4, and 6), we find that B commands a total of 50.9%. In contrast, 49.1% of the voters prefer candidate A (100 - 50.9 = 49.1%).
In summary, while the majority of Mathville residents favor candidate B, candidate A wins due to the voting system's reliance on first-choice preferences, allowing the irrelevant alternative (candidate C) to distort the election outcome.
Addressing the Issue: The Borda Count
Now that we’ve pinpointed the problem, how can we remedy it? Fortunately, this issue has already been tackled, thanks to the insights of 18th-century French mathematician Jean-Charles de Borda.
Borda proposed a system that treats elections as an input-output mechanism, where individual voters' preferences yield a collective result. This method incorporates additional layers of abstraction, enabling us to consider all relevant information, unlike the previous system.

To illustrate, let’s revisit the earlier distribution based on voter rankings:
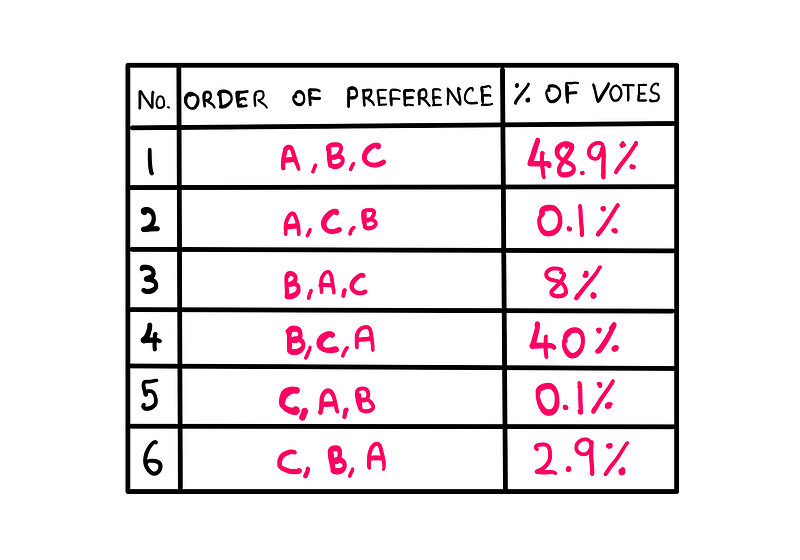
According to Borda's elegant system, each candidate receives points based on their ranking. The rules are as follows:
- Award 2 points for a first-place ranking, 1 point for second, and 0 for third.
- Multiply the points awarded to each candidate by the fraction of voters who selected that ranking combination.
- Finally, sum these products for each candidate to determine their Borda count.
For instance, based on the distribution above, we can compute candidate A's Borda count as follows:
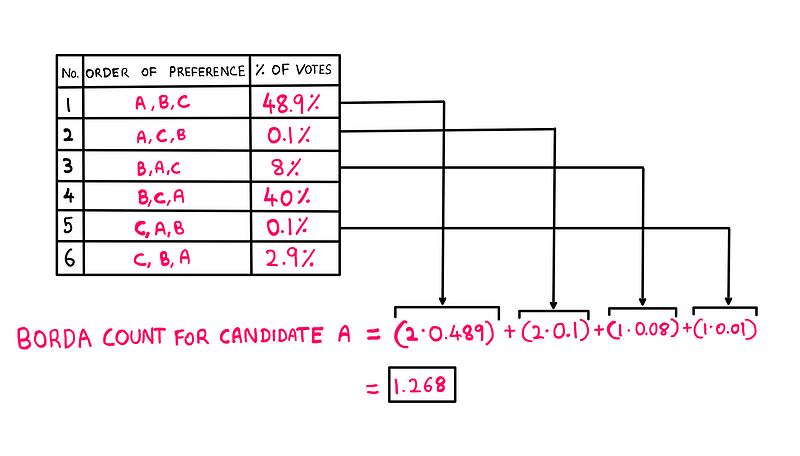
Similarly, we can calculate the Borda counts for candidates B and C:
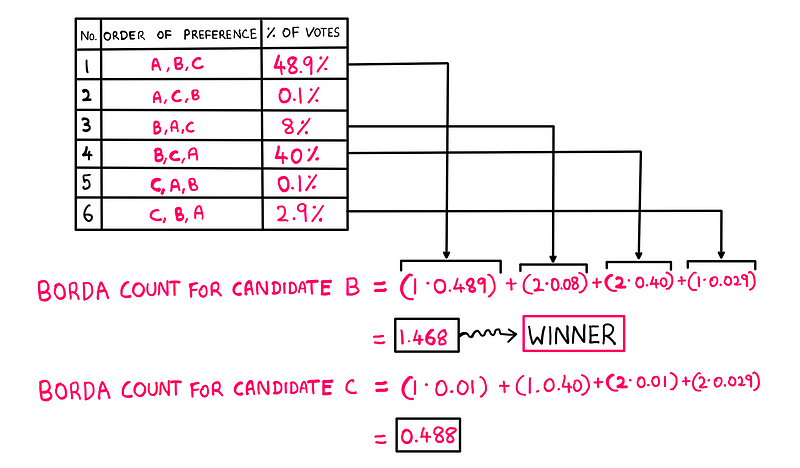
As per the Borda count, the paradoxical election outcome is eliminated, leading to a victory for candidate B!
Final Thoughts
Borda's system, established in 1770, was utilized by the French Academy of Sciences to elect its members for two decades until Napoleon Bonaparte implemented his own method.
Voting systems are often complex, and the concept of "public opinion" may not even hold up under scrutiny. I have discussed this topic in depth in a prior essay about the misleading nature of polls.
Given the intricacies of contemporary elections, the practicality of implementing the Borda count system remains uncertain. However, the reality is that unpopular candidates do manage to win from time to time, illustrating the persistent influence of the asymmetric dominance effect.
Video Insights
To further understand the implications of electoral systems and the mathematics involved, check out the following videos:
The Trouble with the Electoral College discusses how certain electoral systems can lead to unexpected outcomes.
This is why we still have the Electoral College explores the reasoning behind the continued use of the Electoral College and its effects on elections.
A significant analysis from reader William Vaughn highlights an alternative perspective: he examined a table based on the provided data, yielding a different characterization of the candidates.
Candidate A is revealed to be the "extreme" candidate, either adored or despised, while candidate B emerges as the "moderate" option with broad appeal. Candidate C, conversely, is deemed the true "unpopular" candidate, lacking substantial support. This demonstrates how relying solely on first-place votes can yield a skewed representation. Furthermore, candidate B stands out as the overwhelming Condorcet winner.
For those interested in supporting future content, consider contributing on Patreon.
References and credits: Jordon Ellenberg and Jean-Charles de Borda. Special thanks to Elder Taoist and William Crendal for inspiring this essay.
You can read the original essay here.